The Hive Power is an essential parameter for the Hive ecosystem. Hive Power holders are the ones that vote for witnesses, DHF proposals, curate posts, and receive curation rewards. It’s the main asset on the chain.
Is the amount of powered up HIVE (staked) increasing or decreasing?
Let’s take a look at the data.
We will be looking at:
- Hive Powered Up by Date
- Hive Powered Up by Month
- Hive Power Supply
- Hive Power historical Share
- Top Accounts That Powered up
- Top Accounts That Powered Down
Note that in the daily amount of powered up HIVE I have included the HP that is rewarded daily to hive users, as that HP enters in circulation and adds on top of the existing HP.
Daily Hive Power Changes
Here is the chart.
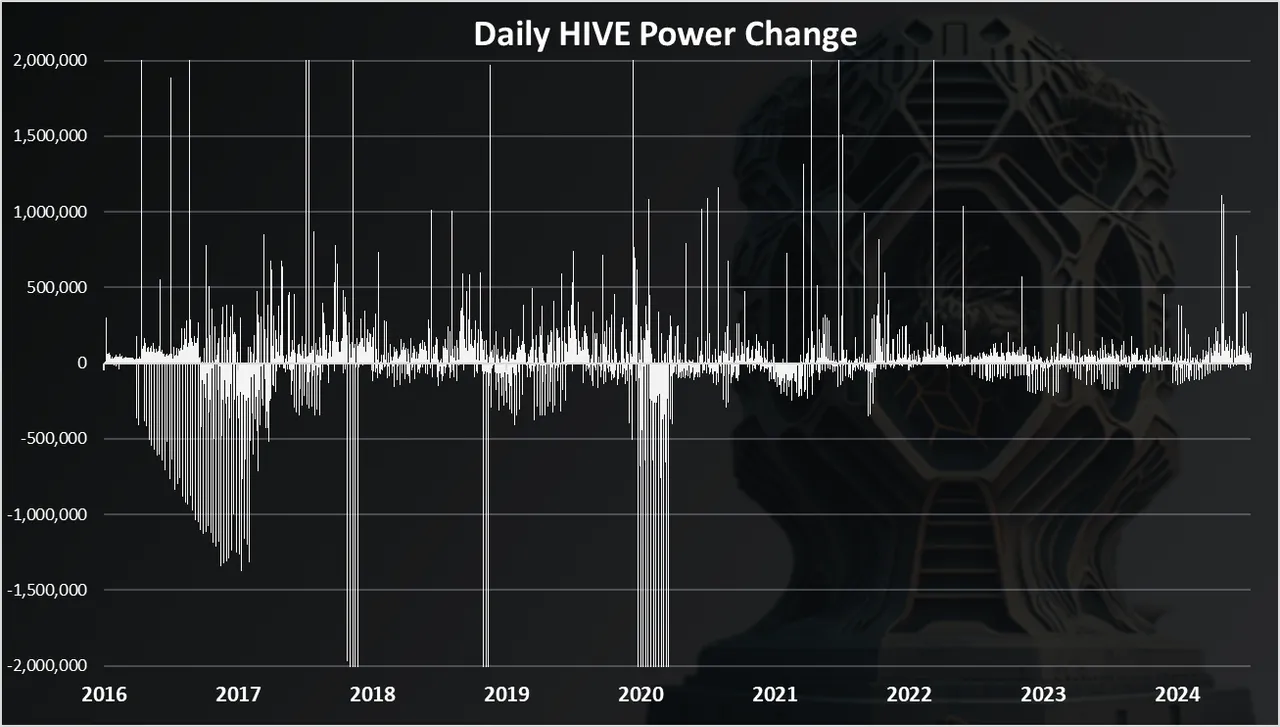
This chart dates to 2016 for context.
As we can see there was a lot of powering down back in 2016-2017. This is because the token started with all the HIVE, or STEEM back then, powered up, and there were no liquid tokens to trade on exchanges.
Another spike in the powering downs is at the beginning of 2018, and again in April 2020.
In the last years we can notice that the volatility has dropped a lot and there is more stability around Hive Power.
When we zoom in 2023-2024 we get this:
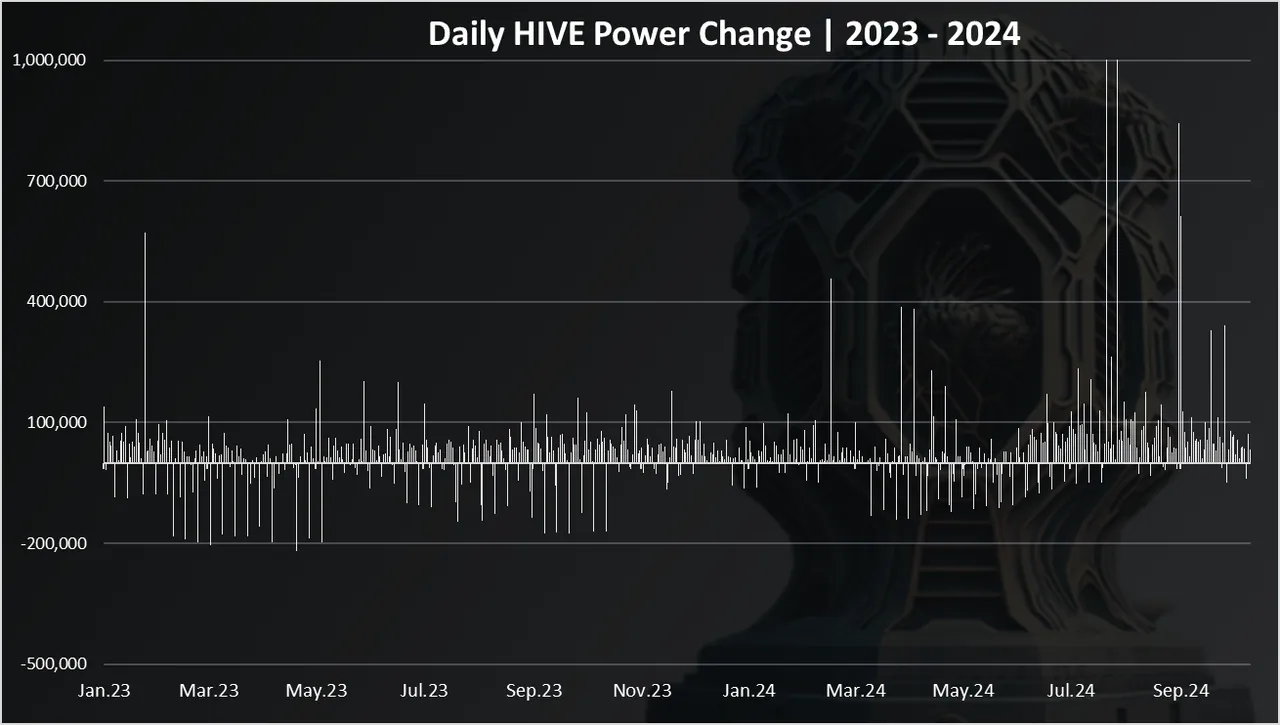
While we can notice the ups and downs, the volatility is much lower than the previous years, and in the range of -200k to +200k HP daily with occasional spikes.
What is noticeable here is the latest spikes in powering up, first in July 2024 on a few occasions there was more than 1M HIVE powered per day, and again at the beginning of September on few occasions around 500k HIVE was powered up.
On a monthly basis we have this:
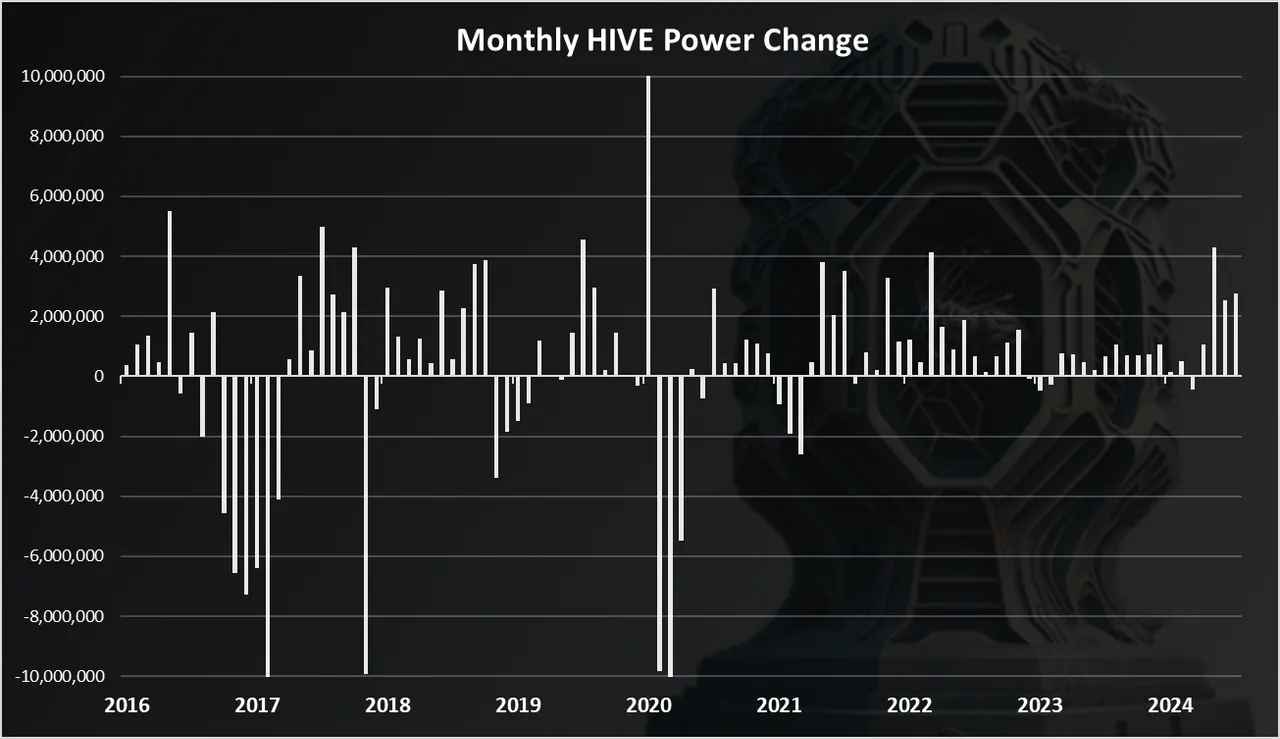
The trend here is similar to the daily chart, with a lot of powering down initially, one more volatility in 2020 when the war for the chain was ongoing, and a more stable data since then.
In 2023-2024 we got this:
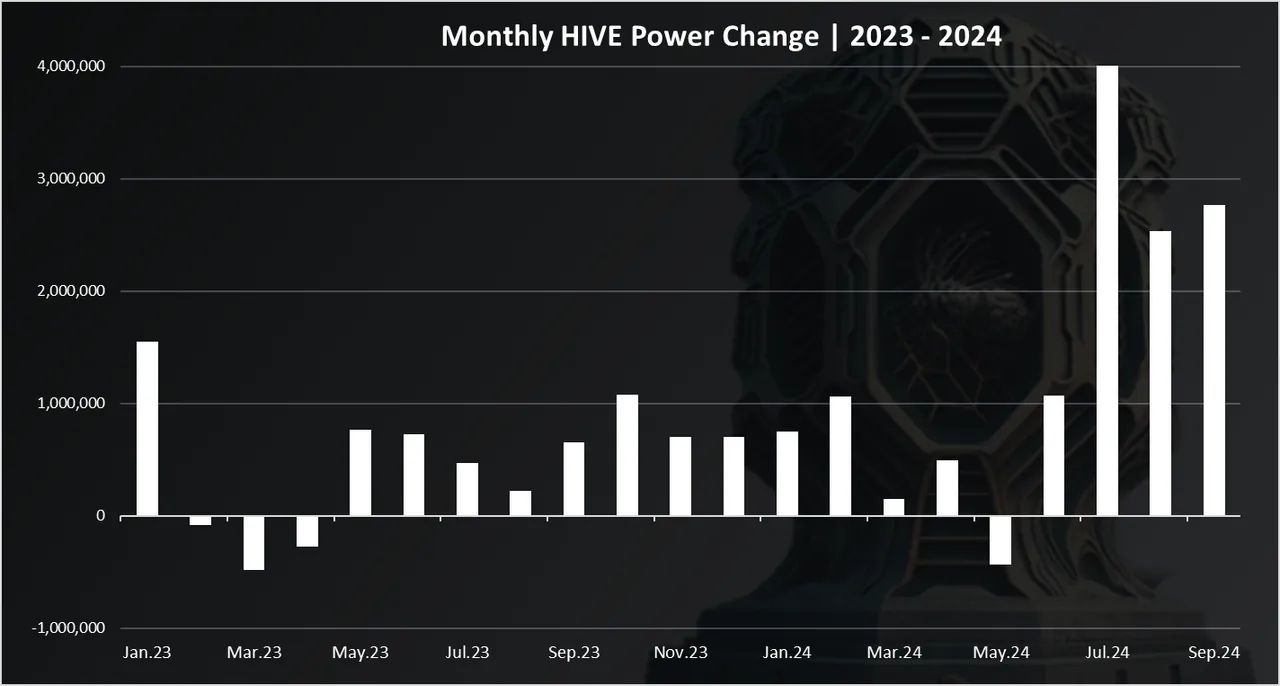
Here we can clearly see the spike in the HIVE powered up in the last few months. Up to July 2024 the amount of HIVE powered up was around 500k to 1M per month, while in July this number was 4M and in the next two months it is close to 3M.
Note that the new HIVE that is entering in circulation is as HP, around 2M per month and this chart is taking into account that as well.
The yearly chart looks like this:
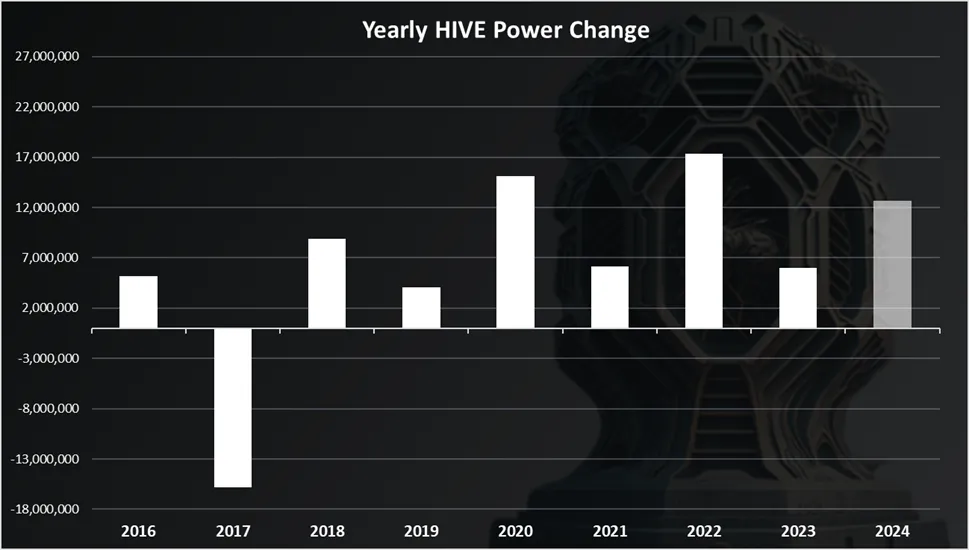
2017 has been the one year with more HIVE powered down. A net 15M HIVE powered down in 2017. 2022 has been a record high year for HP added with 17.5M HP. In 2023 we were around 6M HP while for 2024 we are around 13M for now with three months left up to the end of year. If we add more than 4M HP in the last months, it will be a new record high year for new HIVE power added. This will most likely happen.
HIVE Power Cumulative Supply
When we plot the cumulative HIVE power in the period, against the total supply we get this.
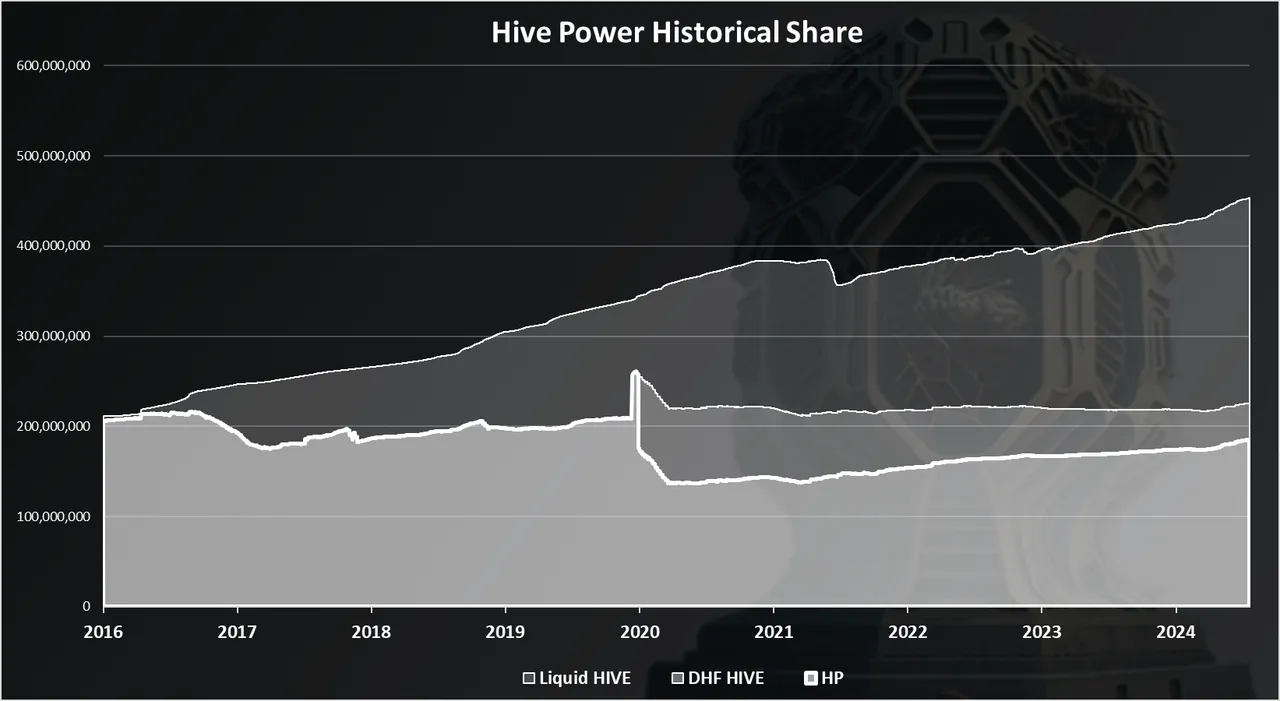
The bottom strongest white is HP, while the share in the middle is the HIVE that is locked up in the DHF. The top is liquid HIVE.
We can notice that in the last years there has been an uptrend in the amount of HIVE Power.
The HIVE in the DHF was previously powered up, but then it was transferred in the DHF and is now slowly converted to HBD over a period of five years.
We can notice the ups and downs in March 2020 when the hostile takeover happened.
Overall, the HIVE Power has been growing slowly in the whole period, but the liquid HIVE has even more aggressive expansion up until 2021. The other thing that influences the liquid HIVE supply is HBD, and when HIVE to HBD conversions happen that reduces the liquid HIVE. The liquid HIVE is attacked so to speak from two sides, HP and HBD.
Hive Power 2020 - 2024
When we zoom in on Hive Power only, we get this:
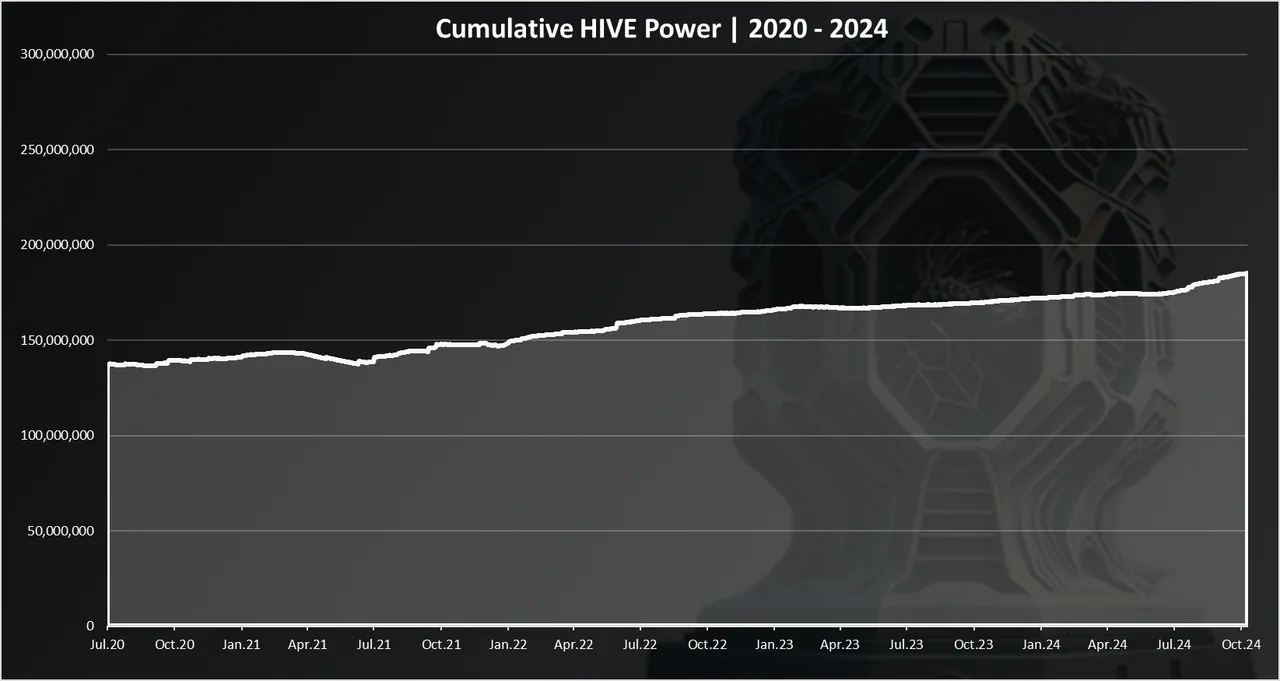
A slow increase in the amount of HIVE powered up, from 140M HP in 2020, to 185M HP now.
The chart for the liquid HIVE looks like this:
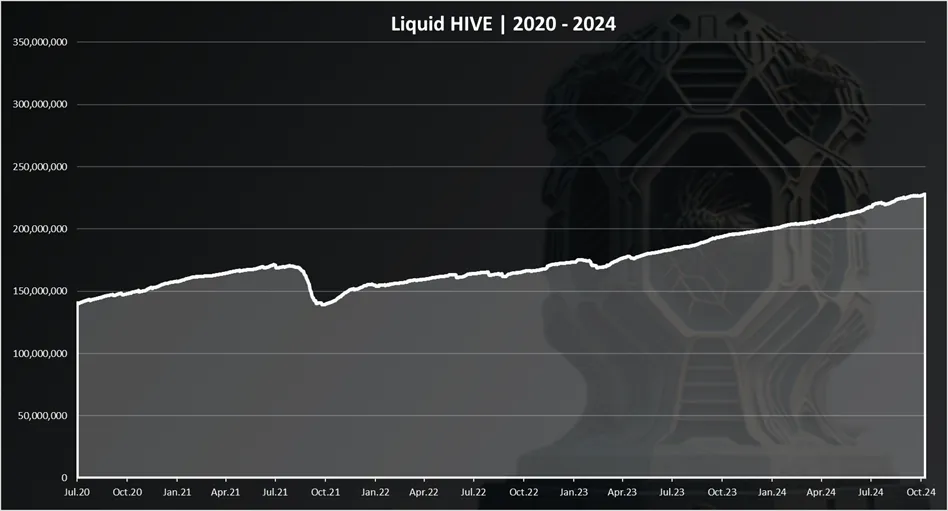
A steady uptrend here as well with some spikes on the downside. This happens usually when there are conversions to HBD.
We can see the drop back in September 2021, when there were a lot of conversions to HBD. A recent smaller drop in February 2023 as well.
In 2020 there was around 145M liquid HIVE and now we are at 228M.
The conversions now play a more important role in the amount of liquid HIVE than the HP itself.
Hive Power Share [%]
Here is the chart in percentage points.
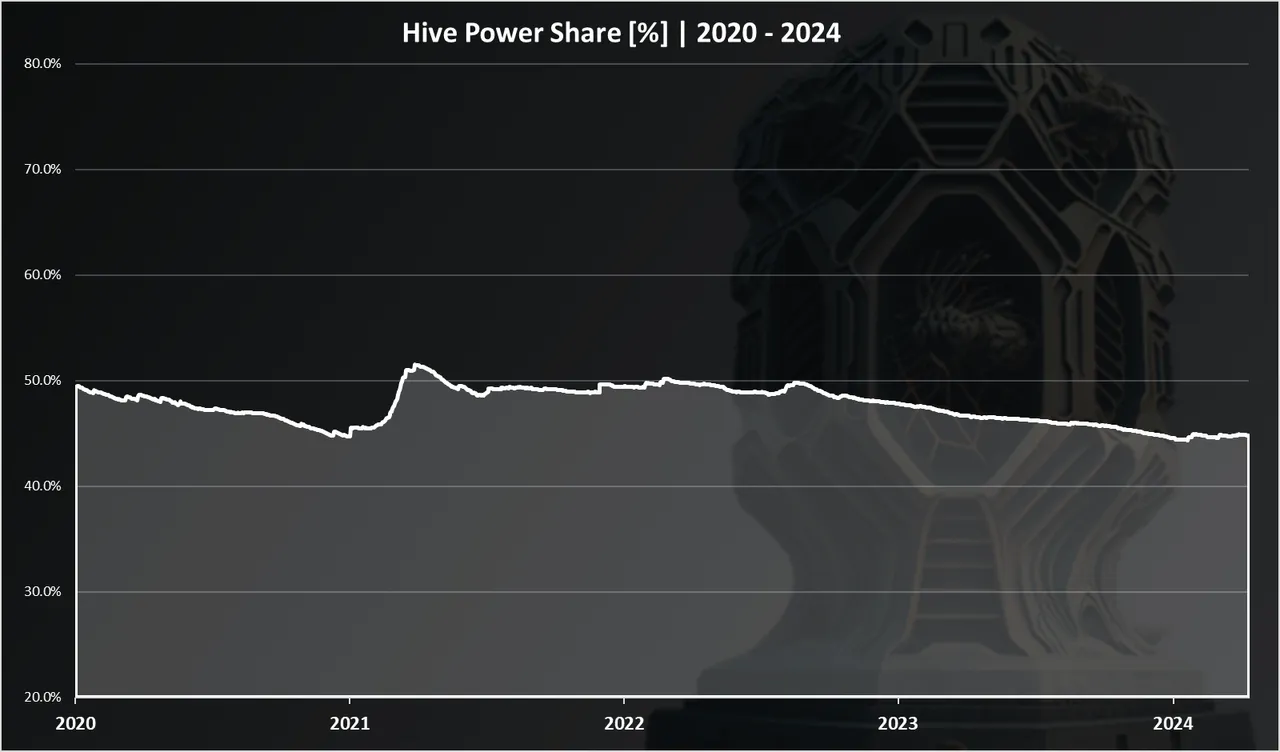
This is from the start of the Hive fork in March 2020.
We can notice that the HP share has been hovering close to 50% for a long time. Back in 2021 this increased to 52% at one point, after a period of decline. In the last year we are again in a slow declining mode with the share of the HP dropping from 49% at the beginning of 2023 to 45% where it is now.
In the last few months the HP share has been around this number, even increased a bit at one point. Might be the bottom for the HP share.
HIVE Supply Share
When we plot the current supply on a pie, we get this.
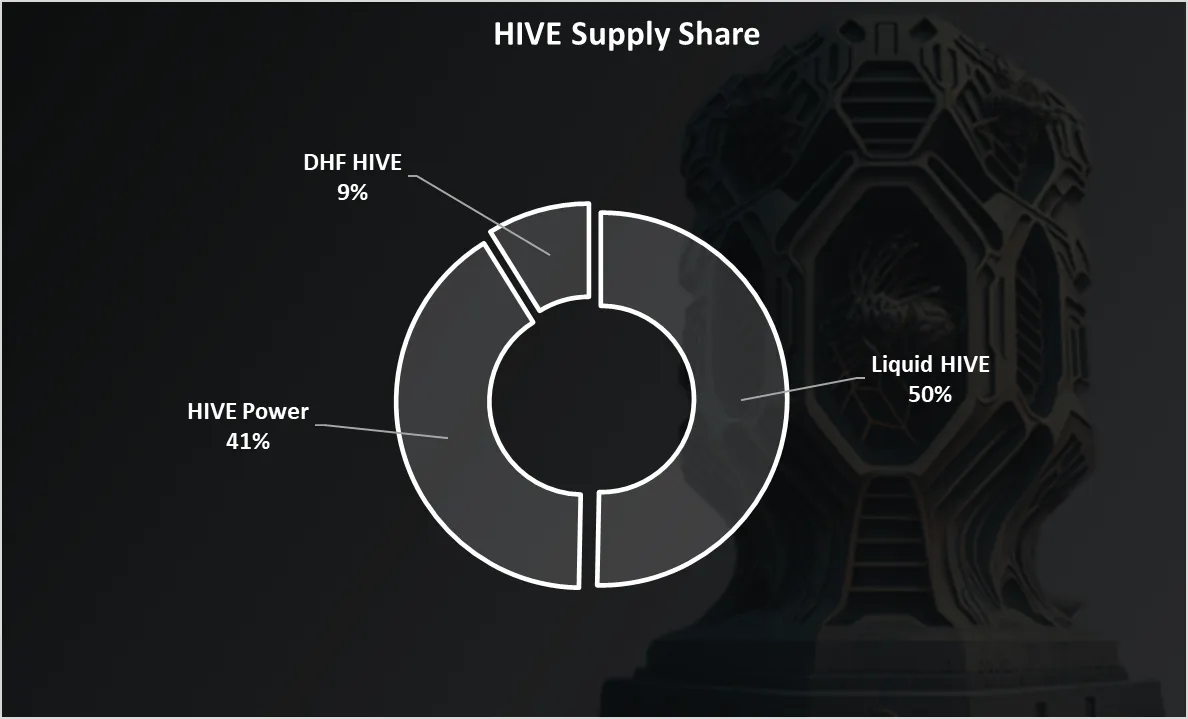
- 41% Hive Power
- 49% Liquid HIVE
- 10% HIVE in the DHF
Having in mind that the HIVE in the DHF is locked we can say that a cumulative 50% of the HIVE supply is powered up / locked.
Top Accounts that Powered Up in 2024
Who is powering up the most?
Here is the chart for 2024.
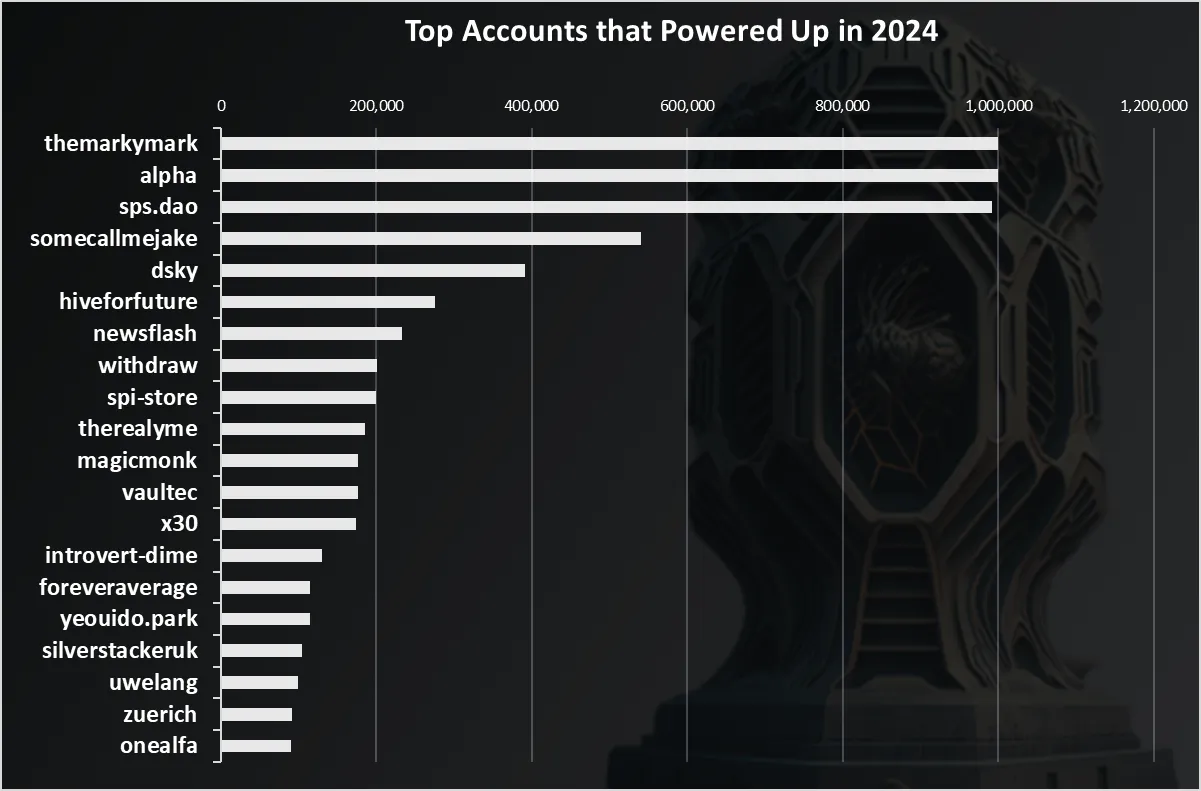
Three major accounts on the top, @themarkymark, @alpha and the @sps.dao. Each of these powered up around 1M HIVE in 2024.
Top Accounts that Powered Down
Who is powering down the most?
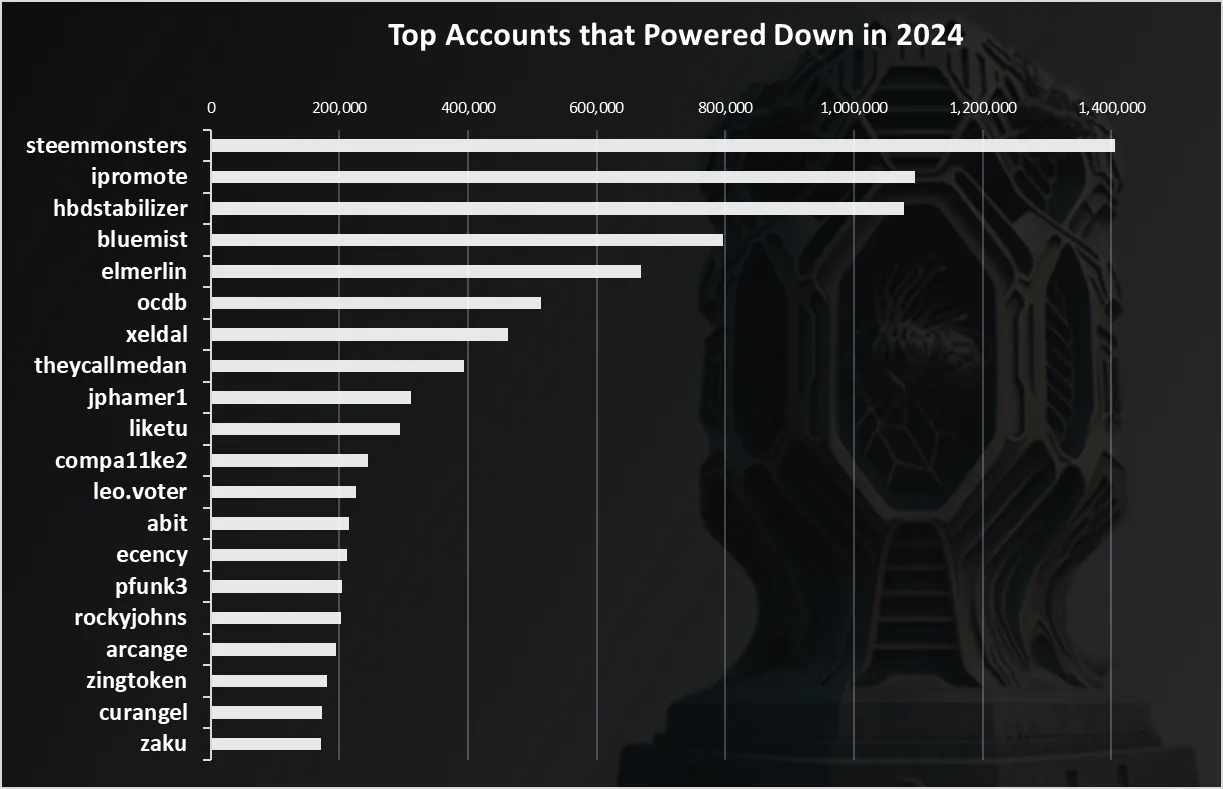
@steemmonsters are on the top here, we can say that the company switched places with the @sps.dao, one powering up, another one powering down. Next are the @ipromote account and the stabilizer that is sending the funds to the DHF.
All the best
@dalz